Economic Graph — Grid of Lights
A choropleth of Mexico that lights up business line by business line.
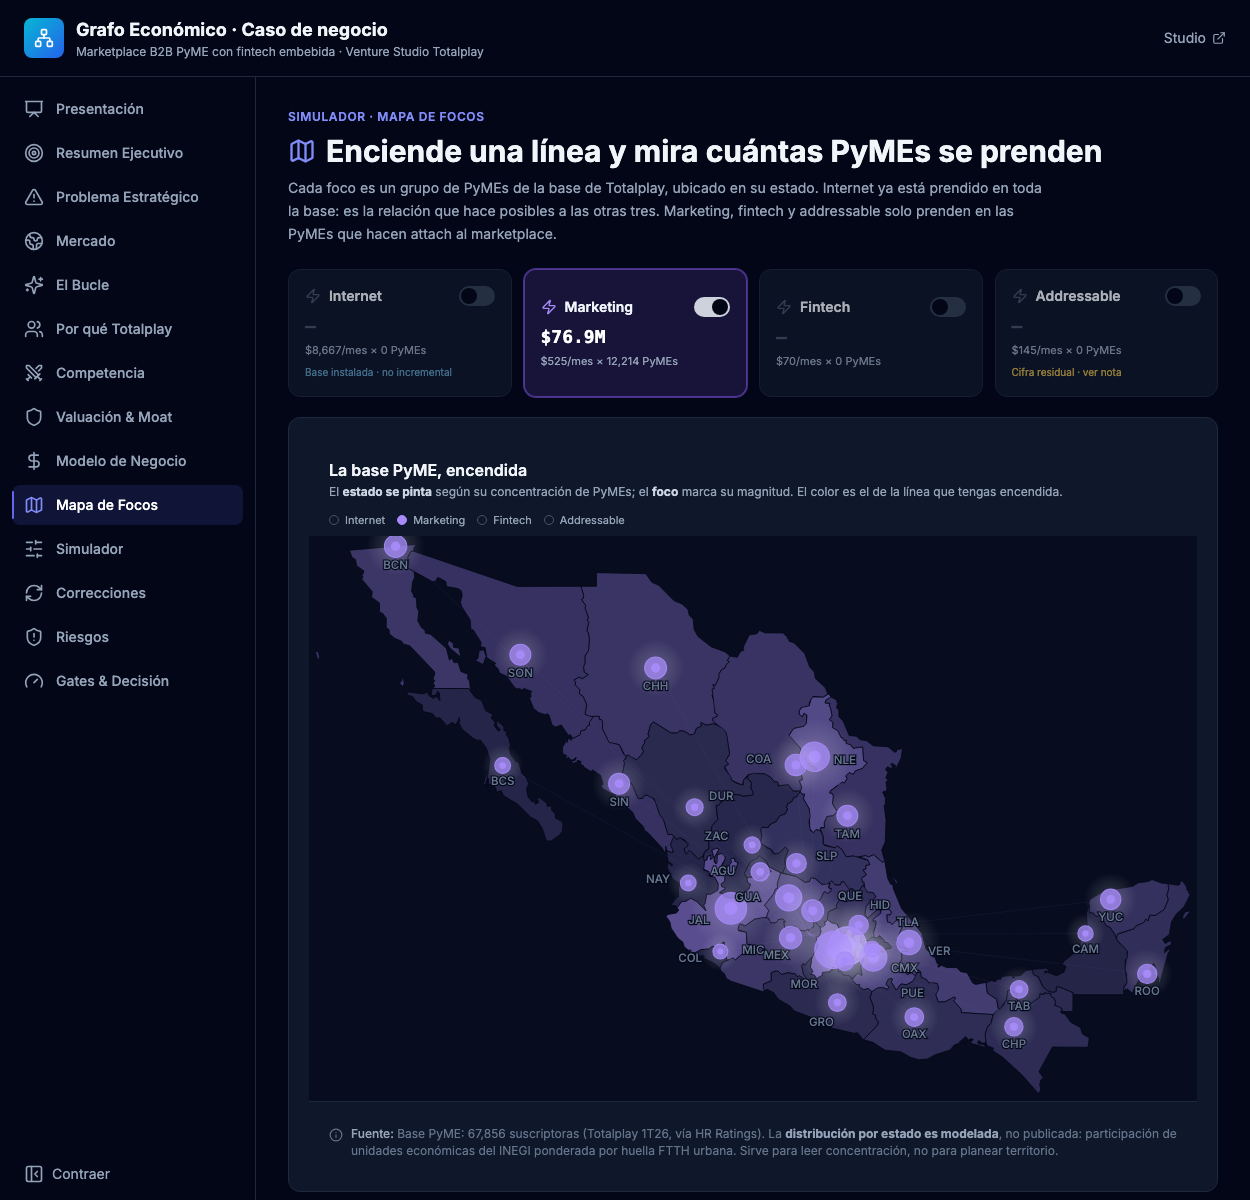
The design and build story behind the interactive map: the 32 states as real polygons, business lines you toggle on, and revenue adding up live over the territory. The full strategy thesis lives in the featured case study.
Context
A Telco→Data-Co transformation case. The thesis isn't about revenue (3-year revenue is 0.3% of the company): it's the multiple re-rating from telco to data. The map had to make that scale felt.
The design problem
A flat number conveys neither the scale nor the geography of the asset. The Committee needed to see the SME base light up on its own, and to trust that every figure traces back to the deck.
Design decisions
The 32 states as real polygons (simplified GeoJSON, bundled)
Real cartography, not floating dots. Bundled with no network calls: a boardroom deck can't depend on internet.
Per-line switches that paint the country and add up revenue
Geography and data share the same projection, so they never drift apart. The thesis becomes something you touch.
Square-root fill scale
With a linear scale, Mexico City crushed the small states and half the country looked empty.
Visual system
- 14-section sidebar; KPI cards with gradients
- Dark palette with one accent per line
- Choropleth + lights on the same equirectangular projection
The highlight
The Grid of Lights turns an abstract financial thesis into a geographic object the Committee switches on and off. Paired with a Telco→Data-Co brand film.